Wi-Fi AR
Visualize your Wi-Fi/LTE coverage!
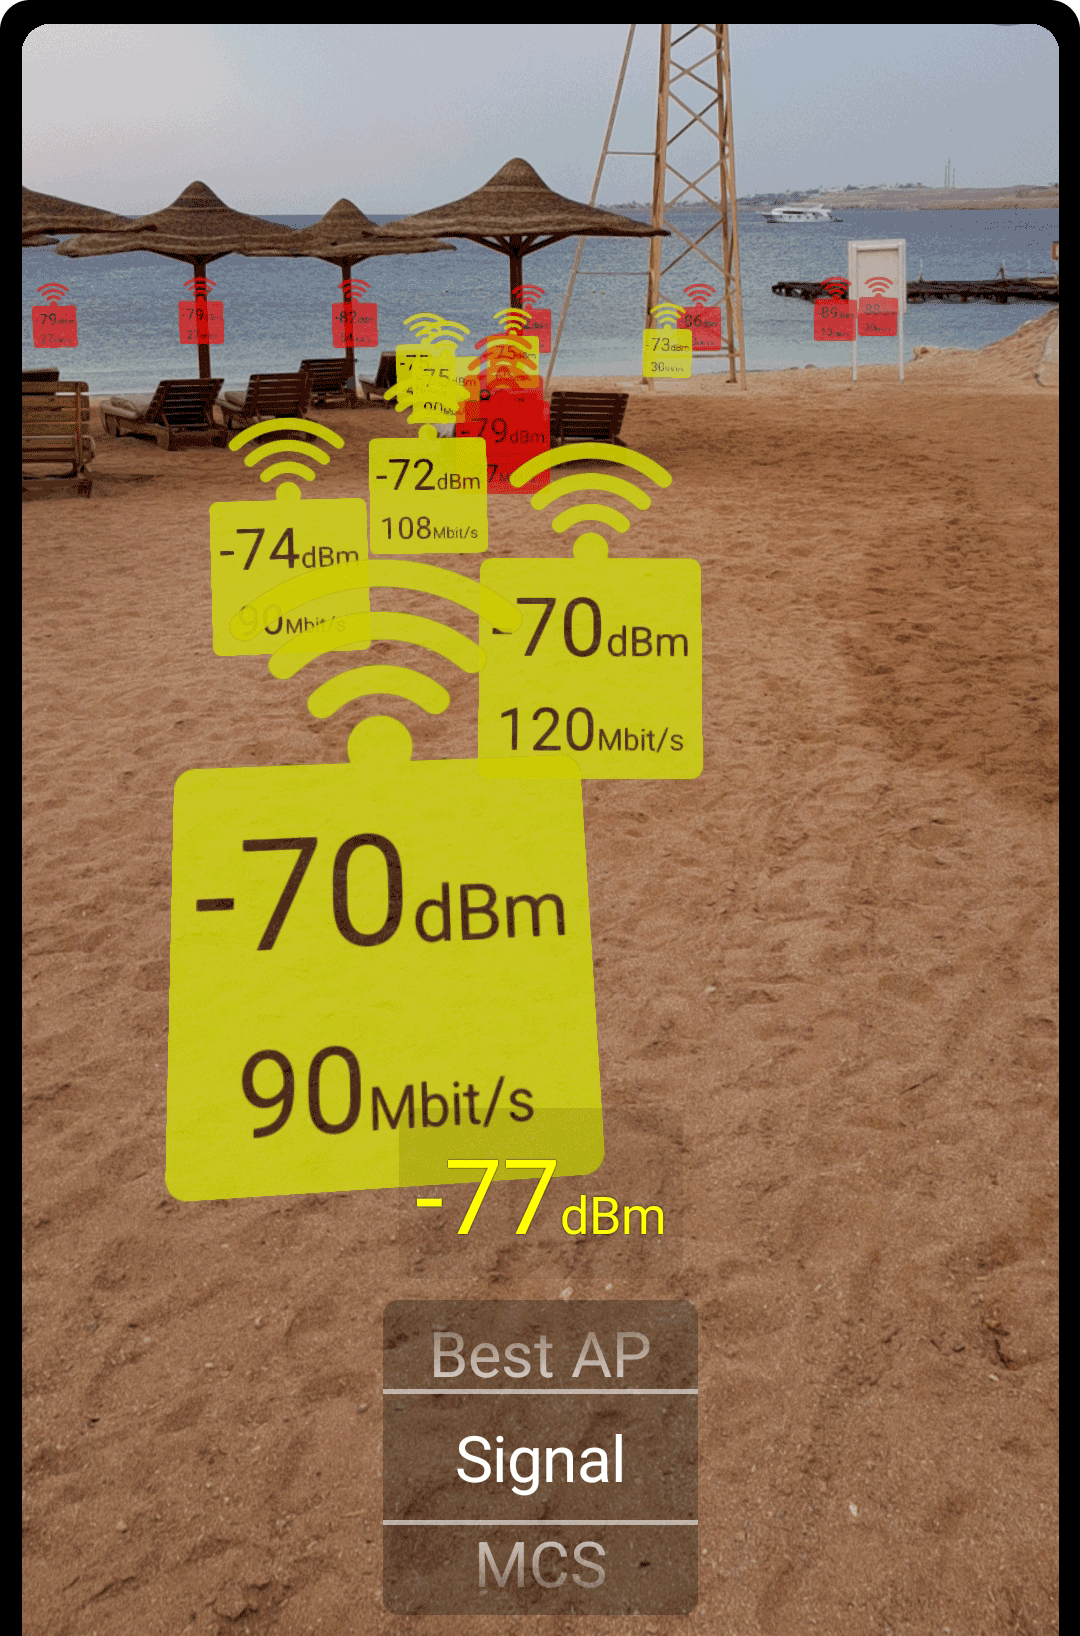
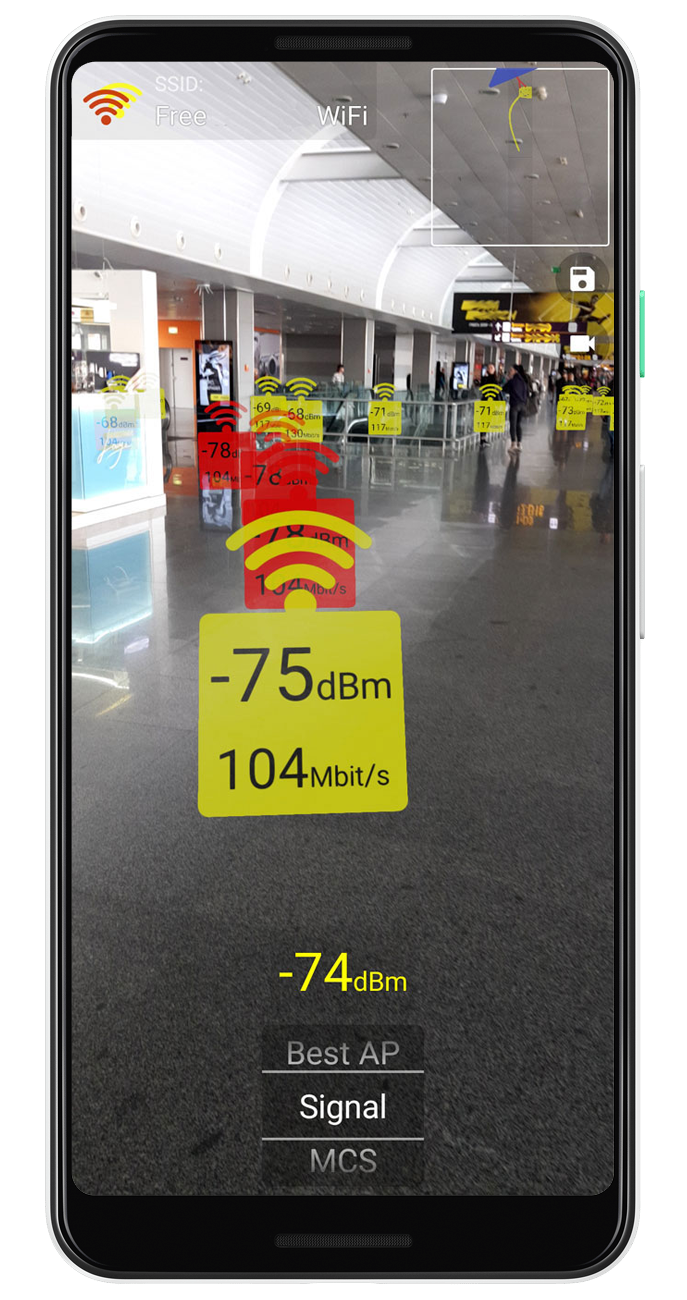
Visualize your Wi-Fi/LTE coverage!
All-automatic data-capture. Just walk though coverage zone and see the result
All required parameters are captured: Signal strength, MCS index, Latency, AP index, Interfering networks, Connection to best AP
Share the results with your IT-specialist to help with setup and diagnosis
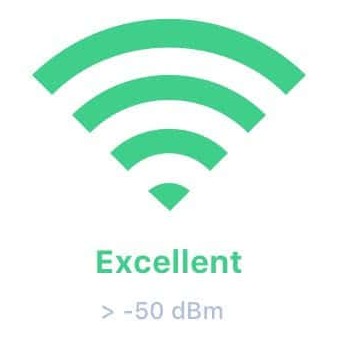
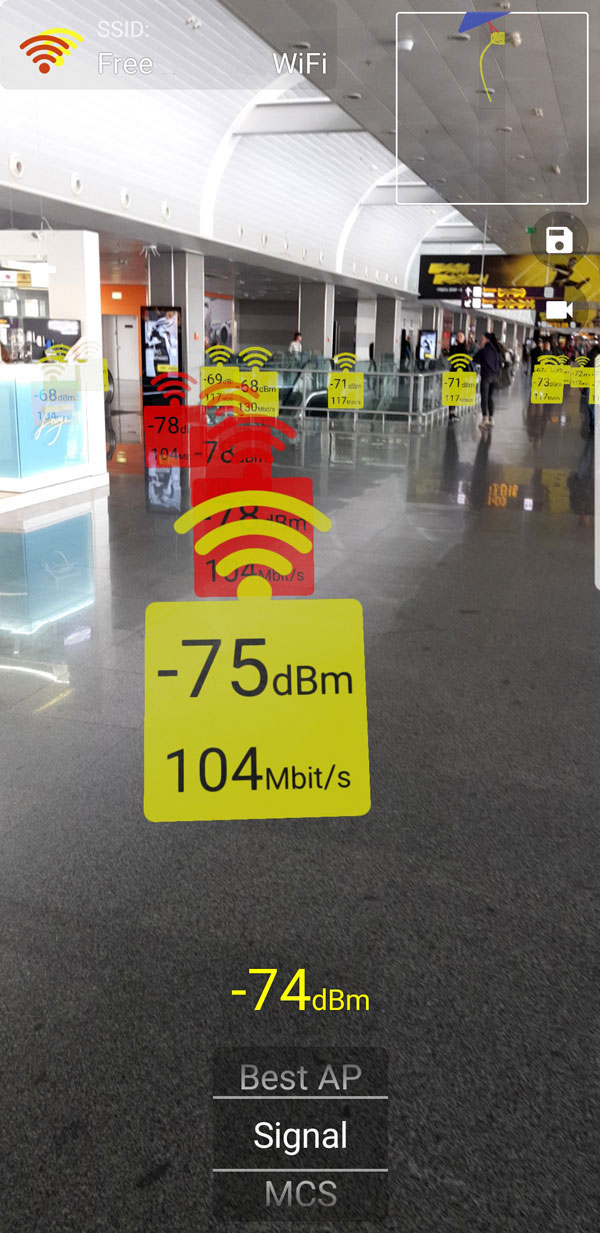
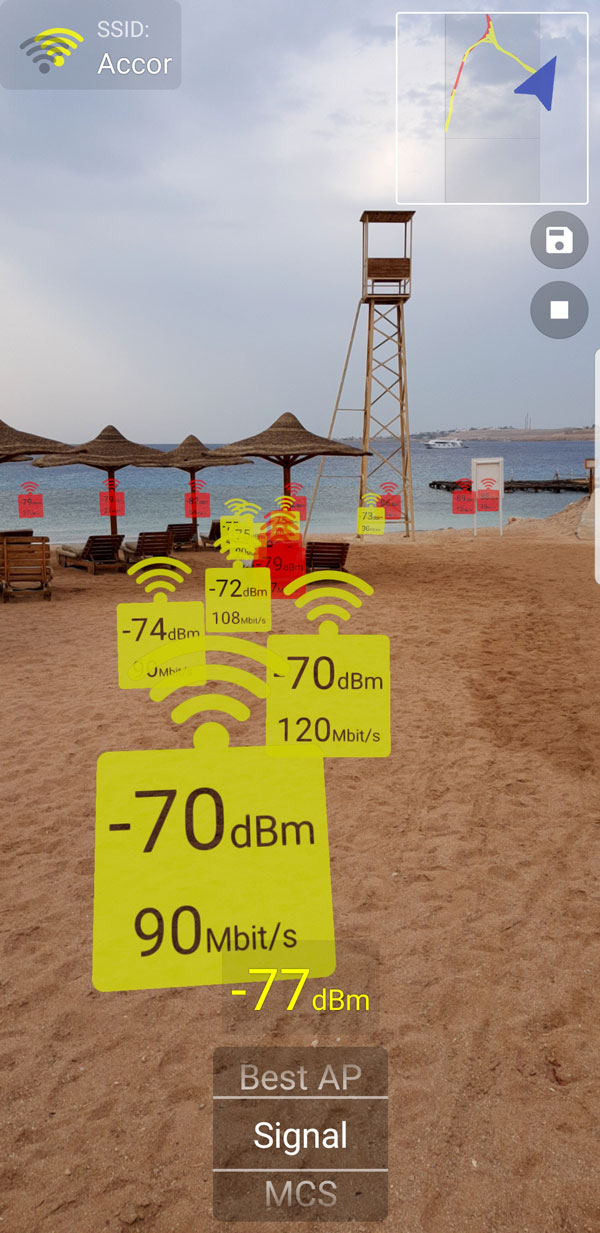
Signal strength, RSSI, or “Received Signal Strength Indicator,” is a measurement of how well your device can hear a signal from an access point or router
It’s a value that is useful for determining if you have enough signal to get a good wireless connection
Signal Strength |
Quality |
Description |
-30 dBm |
Amazing |
Max achievable signal strength. The client can only be a few feet from the AP to achieve this |
-67 dBm |
Very Good |
Minimum signal strength for applications that require very reliable, timely delivery of data packets |
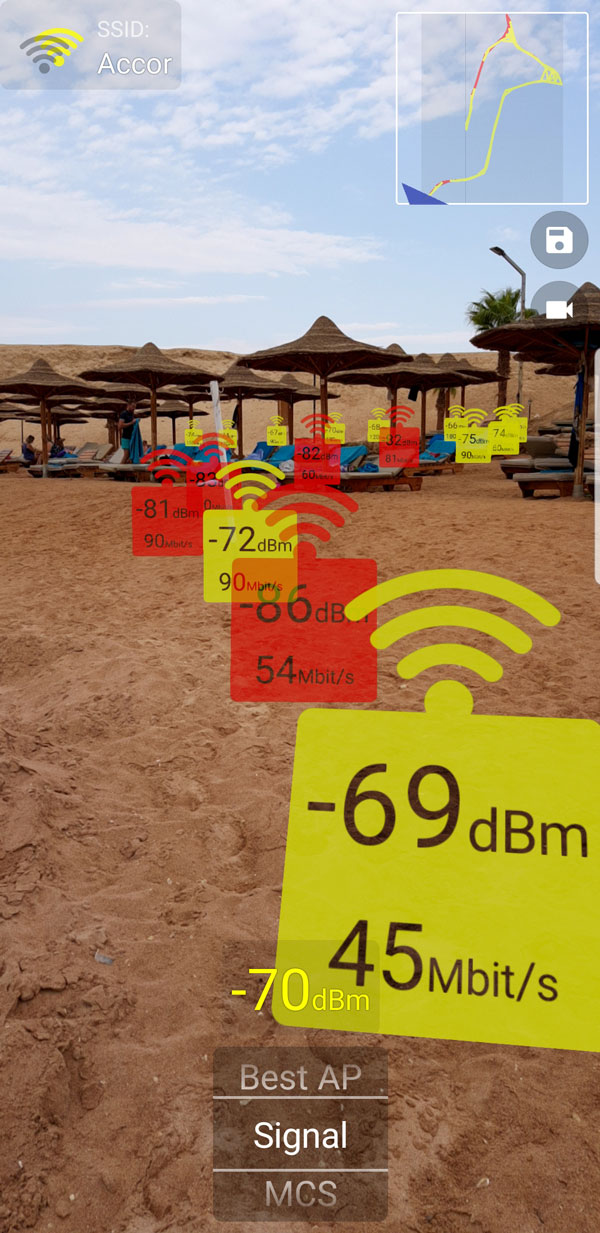
-70 dBm |
Okay |
Minimum signal strength for reliable packet delivery |
-80 dBm |
Not Good |
Minimum signal strength for basic connectivity. Packet delivery may be unreliable |
-90 dBm |
Unusable |
Approaching or drowning in the noise floor. Any functionality is highly unlikely |
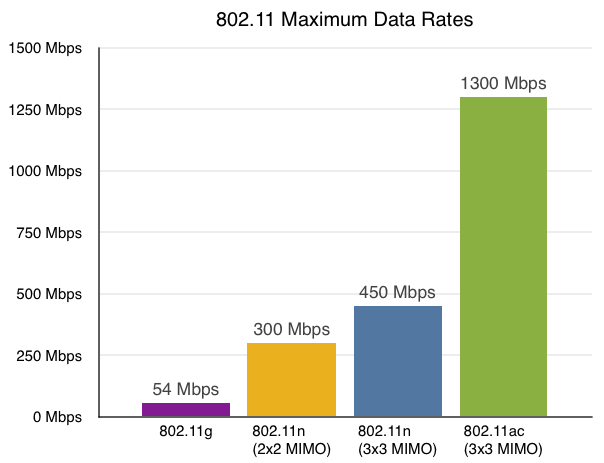
MCS stands for Modulation and Coding Scheme
This is a way to organize data surrounding how transmitters in Wi-Fi prepare data to be sent using various techniques
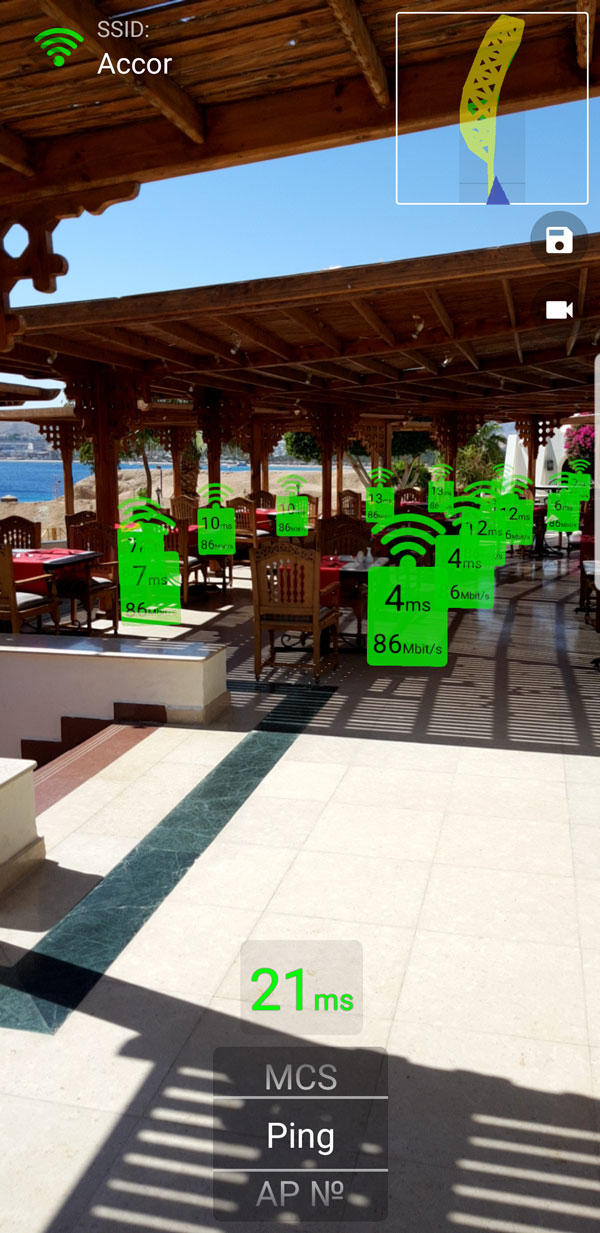
How long it takes data to travel from your smartphone to your Wi-Fi router/gateway
Very basic, very simple, and yet very powerful as a first line of network troubleshooting
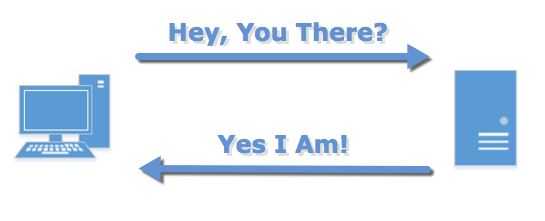
Ping is one of the oldest and most basic network diagnostic tools. It’s present in just about every modern, and even not-so-modern, operating system.
In concept, the tool is very, very simple: it sends out an “Are you there?” kind of request, and expects to hear back a “Yes, here I am!” kind of response
Other powerful WiFi networks that overlap your existing network
If the Wi-Fi networks around are using the same frequency channel they might be causing the interference as well.
So if more than one network is using the same channel, there will always be a competition for the bandwidth. Large apartment buildings are especially prone to interference issues because more WiFi networks are overlapping and probably using same channels.
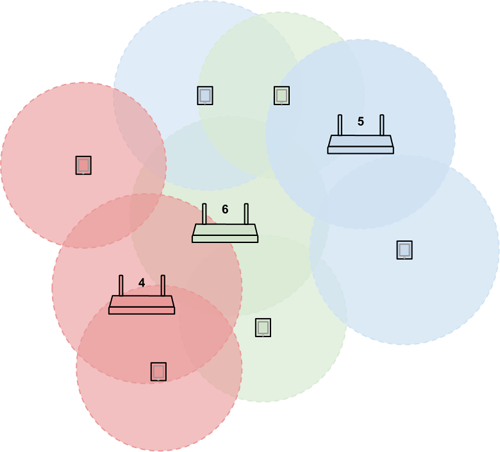
AP index
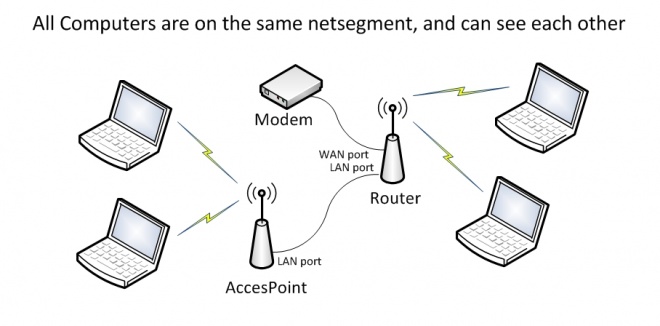
If your network has more than one AP you will see AP no. to which you are connected now.
Best AP connection
If your network has more than one AP, you shoul be connected to one AP with better signal level. If not, you will see that your network is not correctly setup and better AP with greater signal value is available.
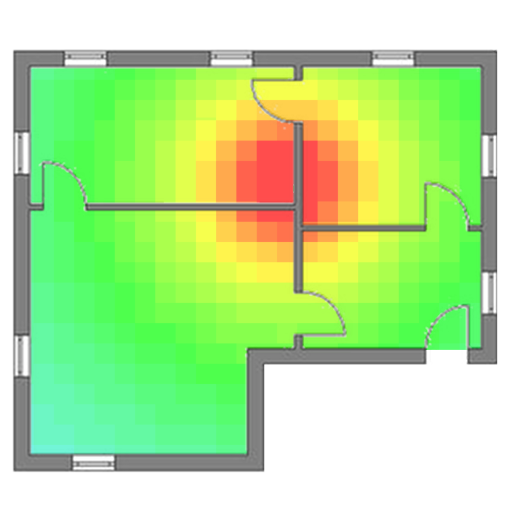
Just walk through your Wi-Fi coverage zone to collect data points
Look at your Wi-Fi coverage quality in real-time mode. Switch between multiple parameters like signal level, connection speed, latency, etc.
Capture video or save map-preview, and share them with IT-specialist
Most powerful wireless diagnosis tool ever
Use it indoor, creating your true coverage zone, or try outdoor mode with GPS supportPlay Store
Most powerful wireless diagnosis tool ever
Use it indoor, creating your true coverage zone, or try outdoor mode with GPS supportPlay Store
Most powerful wireless diagnosis tool ever
Use it indoor, creating your true coverage zone, or try outdoor mode with GPS supportPlay Store

This app requres Google ARCore library to work properly. List of supported devices available here.
Starting Android 8 (SDK 26), Fine location permission is required to get Wi-Fi scan results. In theory, if we have list of All of the Wi-Fi networks in the world we can determine your location. Anyway, we do not share or collect your scan results in any way. Reference to the datasheet with scan function description.
Please find them in WiFiAR device folder. Reachable from gallery.
 Google play